Variable Extraction
After data configuration, we move on to variable extraction. This is when we perform the actual data extraction on the data set. Since data is already properly configured for extraction, the variable extraction step is typically very easy. This step usually consists of running simple commands in the software that are compatible with your data set.
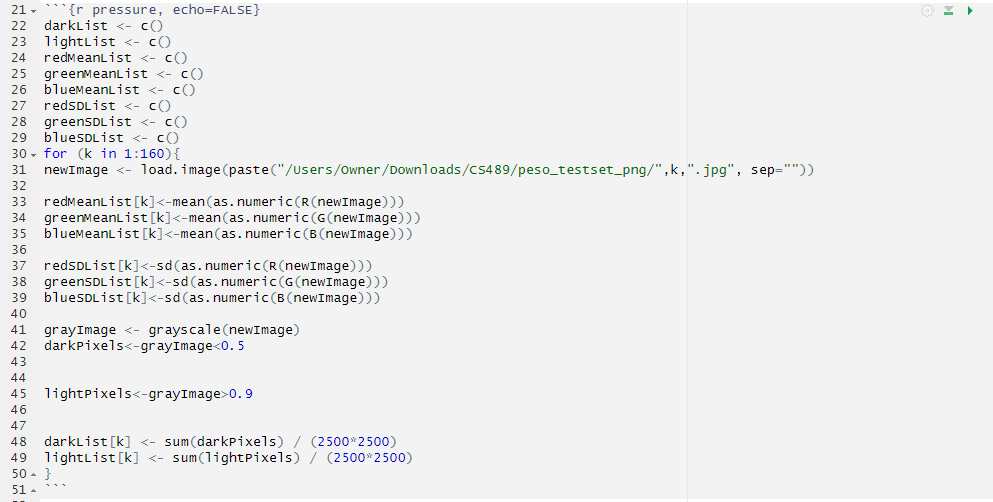
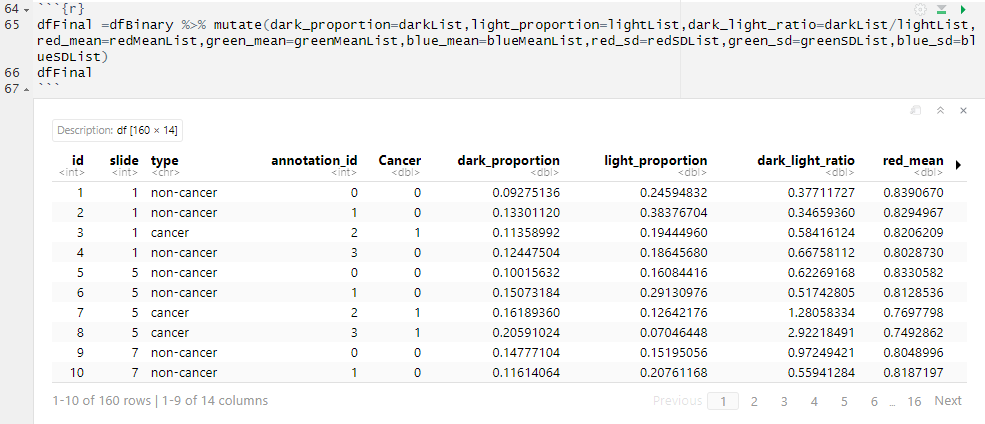
For our case study, empty vectors are created that will eventually contain the variables. Then, a for loop is used to extract variables from each of the 160 images. On line 31, a new image is uploaded as a variable in R. Next, the as.numeric(R()), as.numeric(G()), and as.numeric(B()) commands are used to extract the red, green, and blue channels from each pixel in the images as numerical values. This allows the means and standard deviations for the color channel values of the pixels in each image to be calculated and used as representations of the red, green, and blue intensities in the images. On line 41, a grayscale copy of the image is created. This allows for a simple threshold to be used to obtain counts of dark and light pixels in the grayscale image. The proportions of light and dark pixels in an image are then calculated by dividing the counts by the number of pixels in an image. All of these extracted variables are stored in their respective vectors, which were created in lines 22-29. These variables are then added into the dataframe using the mutate() function.

Code for Data Extraction

Code to add new variables to dataframe